The XKCD font (as used by matplotlib et al.) recently got an update to include lower-case characters. For some time now I have been aware of a handwriting sample produced by Randall Munroe (XKCD's creator) that I was interested in exploring. The ultimate aim is to automatically produce a font-file using open source tools, and to learn a few things along the way.
The thing about fonts is that there is actually a lot going on:
- spacing - the whitespace around a character
- kerning - special case whitespace adjustments (e.g. notice the space between "Aw" is much closer than between "As")
- hinting - techniques for improved rasterization at low resolution
- ligatures - special pairs/groups of characters. The traditional example is ffi, but for hand-writing, any character combination is plausible.
The raw material I'm going to use is a scan produced by XKCD author Randall Munroe containing many characters, as well as some spacing and ligature information. Importantly, all of the glyphs have been written at the same scale and using the same pen. These two details are important, as they will allow us to derive appropriate spacing and kerning information, and should result in a font that is well balanced.
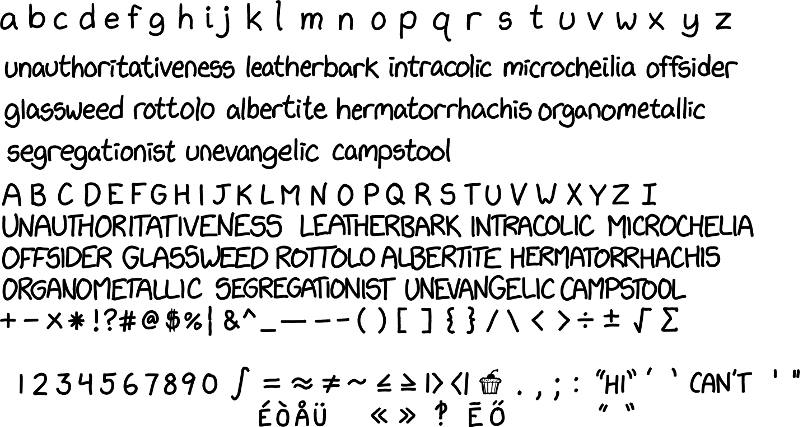
(full image available on GitHub at https://github.com/ipython/xkcd-font/issues/9#issuecomment-127412261)
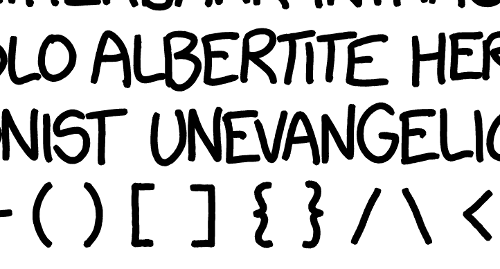
Notice some interesting features of this sample, including ligatures (notice that "LB" is a single mark) and kerning (see the spacing of "VA"):
There are a few useful articles already out there on this topic, particularly one from 2010 regarding the creation of fonts from a hand-written sample. Notably though, there isn't much that is automated - this is a rub for me, as without automation it is challenging for others to contribute to the font in an open and diffable way.
Let's get stuck in by separating each of the glyphs from the image into their own image.
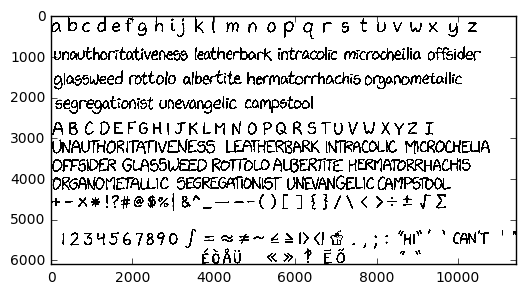
We start by getting hold of the image as a numpy array. Original image cropped from https://github.com/ipython/xkcd-font/issues/9#issuecomment-127412261:
import matplotlib.pyplot as plt
hand = plt.imread('../../images/xkcd-font/handwriting_minimal.png')
This is a pretty beefy image, so we will want to cut it down a little whilst doing some development. Once we are happy with the process, we can then use the full image:
print(hand.shape)
plt.imshow(hand)
plt.show()
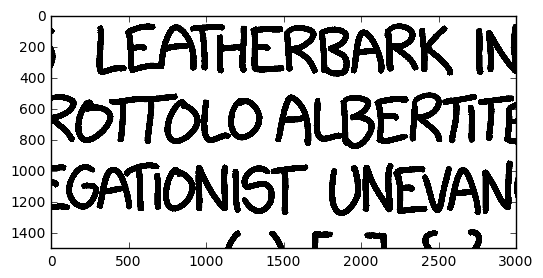
Before we even start, notice that some of the characters overlap, and even touch one another. This isn't going to be a clean bounding box type problem:
small_image = hand[3000:4500, 4000:7000]
plt.imshow(small_image)
plt.show()
from skimage.color import rgb2gray
from skimage.color.colorlabel import label2rgb
from scipy import ndimage as ndi
import numpy as np
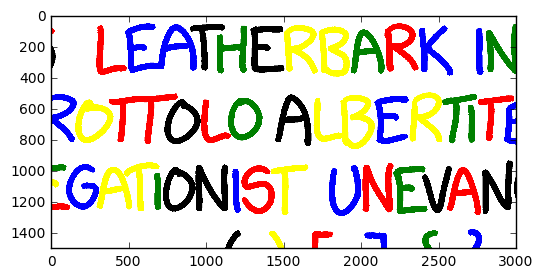
Convert to grayscale, and label the image by distinct marks.
small_image_gray = rgb2gray(small_image)
labels, _ = ndi.label(small_image_gray < 1)
Now convert the labels to RGB so that we can see our different segmentations:
labels = np.ma.masked_equal(labels, 0)
label_img = label2rgb(labels.data, colors=['red', 'blue', 'green', 'black', 'yellow'],
                      bg_label=0, bg_color=(1, 1, 1))
plt.imshow(label_img)
plt.show()
Our first attempt to separate the letters has had some success. Let's compute each glyph's bounding box, and add that to the image. Initially, I tried using scipy.ndimage.measurements.extrema to give me each label's bounding box, but ended up needing to brute-force it using np.where.
Note from the future: * skimage.measure.regionprops is the best tool for the job.*
glyph_locations = {}

for i in range(1, labels.max()):
    ys, xs = np.where(labels == i)
    bbox = [xs.min(), ys.min(), xs.max(), ys.max()]
    glyph_locations[i] = bbox
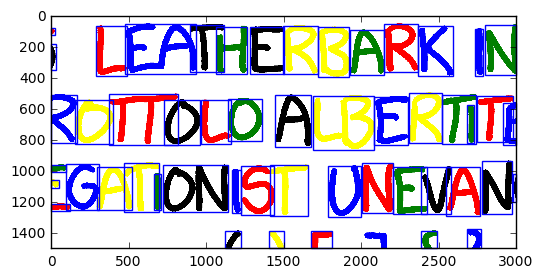
Now that we have the locations of the labels, let's draw a rectangle around each distinct label.
import matplotlib.patches as mpatches

ax = plt.axes()
plt.imshow(label_img)

for glyph_i, bbox in glyph_locations.items():
    height, width = bbox[3] - bbox[1], bbox[2] - bbox[0]
    rect = mpatches.Rectangle([bbox[0], bbox[1]], width, height,
                             edgecolor='blue', facecolor='none', transform=ax.transData)
    ax.patches.append(rect)

plt.show()
Conclusion
In this initial phase, we haven't done anything particularly clever - we've simply loaded in the image, taken a subset, and used scipy's image labelling capabilities to understand what the labelling process looks like. Originally I had planned to try to separate some of the glyphs that were obviously fused together - I'd even gone as far as prototyping using a filter to dissolve the outline (so that I could separate the labels) and then subsequently growing the labels again back to their original form (but keeping the separate labels). This technique worked, but it produced shapes that weren't perfect, and the complexities (e.g. handling of bits that disappeared, such as dots on the letter "i") weren't worth it.
In the next phase, we will use the technique shown here to generate individual image files. In addition, we will apply some heuristics merge back together glyphs such as the dot and comma of a semi-colon.
The next article in this series is: Segment, extract, and combine features of an image with SciPy and scikit-image.
Follow up items (some not yet written):
- Blending together obvious glyphs
- Converting to vector
- Generating the font with font-forge