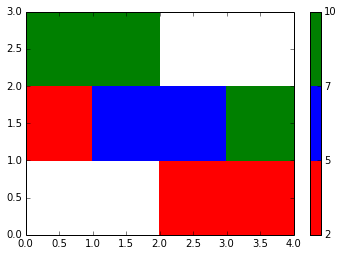
I recently added a new function to matplotlib to make it easier to draw pseudo-colour plots given specific levels and colours, in exactly the same way as you can with contour and contourf.
import numpy as np
import matplotlib.pyplot as plt

from matplotlib.colors import from_levels_and_colors

cmap, norm = from_levels_and_colors([2, 5, 7, 10], ['red', 'blue', 'green'])
data = np.arange(12).reshape(3, 4)

plt.pcolormesh(data, cmap=cmap, norm=norm)
plt.colorbar()
plt.show()
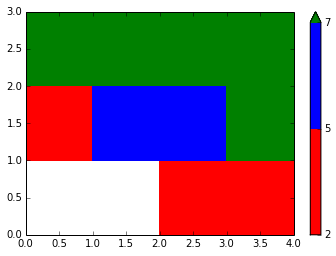
It's also possible to easily add "extend" like capabilities, similar to that of contourf
import numpy as np
import matplotlib.pyplot as plt

from matplotlib.colors import from_levels_and_colors

cmap, norm = from_levels_and_colors([2, 5, 7], ['red', 'blue', 'green'], extend='max')
data = np.arange(12).reshape(3, 4)

plt.pcolormesh(data, cmap=cmap, norm=norm)
plt.colorbar()
plt.show()
If you already have a colormap that you want to use as the source of your colours it is possible to call the colormap with the index of the colour.
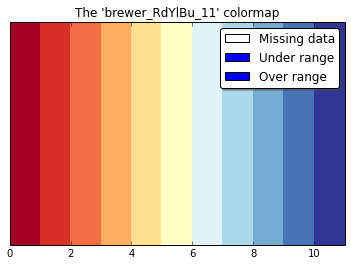
I'm going to be using Iris' nice descrete Brewer colour palettes
import iris.palette
import matplotlib.pyplot as plt
import numpy as np
from matplotlib.colors import NoNorm

nice_cmap = plt.get_cmap('brewer_RdYlBu_11')

plt.figure(figsize=(20, 0.5))
plt.title('The "brewer_RdYlBu_11" cmap')
plt.pcolormesh(np.arange(nice_cmap.N).reshape(1, -1), norm=NoNorm(), cmap=nice_cmap)
ax = plt.gca()
ax.yaxis.set_visible(False)
ax.autoscale_view(tight=True)
plt.show()

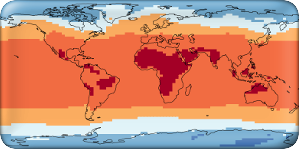
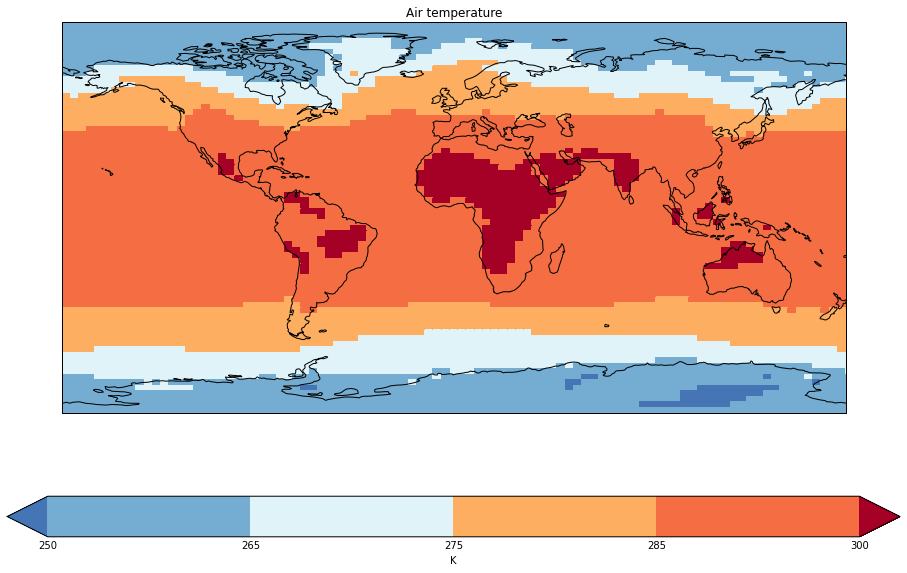
Lets go ahead and start using the new from_levels_and_colors function.
import iris
import iris.palette
import iris.quickplot as qplt
from matplotlib.colors import from_levels_and_colors
import matplotlib.pyplot as plt
import numpy as np

fname = iris.sample_data_path('air_temp.pp')
temperature = iris.load_cube(fname)

nice_cmap = plt.get_cmap('brewer_RdYlBu_11')
# Pick some of the nicer colors from the palette...
colors = nice_cmap([9, 8, 6, 3, 2, 0])
levels = [250, 265, 275, 285, 300]

cmap, norm = from_levels_and_colors(levels, colors, extend='both')

plt.figure(figsize=(16, 10))
qplt.pcolormesh(temperature, cmap=cmap, norm=norm)
plt.gca().coastlines()
plt.show()
For the record, the PR also adds a new method on a colormap instance to quickly see what it looks like (EDIT: Sadly, this was removed from the pull request):
nice_cmap.peek()